
Data mining is a technological advancement methodology that is used to detect information from huge data sets. Many businesses and industries use it to identify patterns, trends, and rules that help us in understanding data behaviour contextually.
Data mining has a vast use and functionality in big data. With the help of mathematical analysis, data mining is done and deals with a huge volume of data which was not possible through the old methods of data exploration. In this blog, we will explore some data mining functionalities that are used to predict the type of patterns in data sets.
Generally, data mining techniques are categorized as:
• Descriptive data mining: This helps in offering knowledge about the data such as count and average. It explains what is happening inside the data without comparing it with any previous idea. You will see the general properties of the data present in the database.
• Predictive data mining:This allow the developers and businesses to know what could happen using the data that are not explicitly available. For instance, the data mining process will predict business in the next month by looking at the previous month’s business.
What are the functions of data mining?
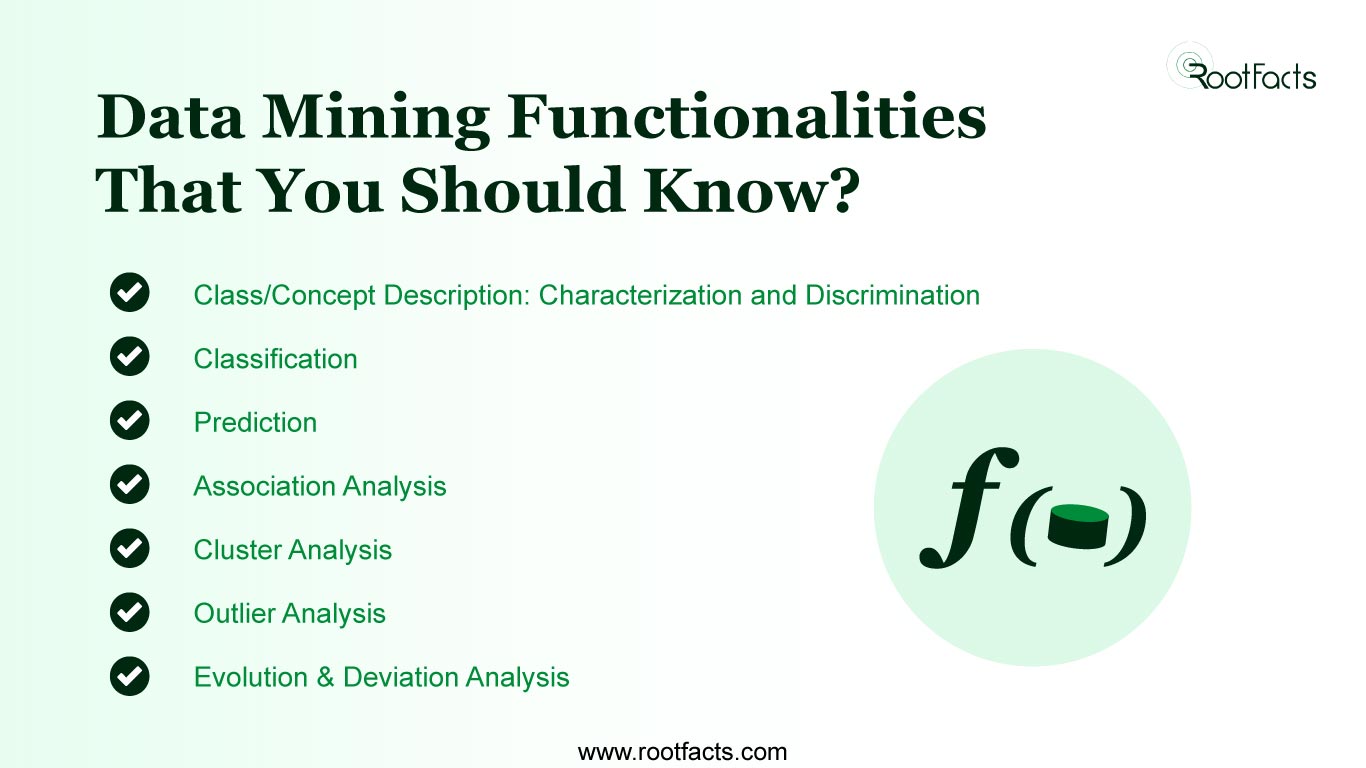
Below are some more functions of data mining:
• Class/Concept Description: Characterization and Discrimination
• Classification
• Prediction
• Association Analysis
• Cluster Analysis
• Outlier Analysis
• Evolution & Deviation Analysis
1. Class/Concept Description: Characterization and Discrimination
Data is related to classes and concepts. For example, the Apple laptop has released its variant to target different customers based on their requirements for MacBook Air and Pro.
Data characterization
Data Characterization is when you summarize the data into general features. It shows the characteristic rules for the target class, such as MacBook buyers.
The general data is collected and presented in graphs, pie charts, line charts, and bar charts. This presentation shows the relationship between the data in a rule called the characteristics rule of the target class.
Data discrimination
It will compare the data between the two classes. It will target a predefined group or class and compare the characteristics of the class with the predefined class using a set of rules known as discriminant rules.
2. Classification
It operates data models to forecast the movements in data. For instance, it uses techniques like IF-THEN, mathematical formulae, decision trees, or neural networks to analyse a model. Also, training data is used to produce new models and compare them with the existing ones.
3. Prediction
Prediction helps in finding the missing values in the data. By using regression analysis, we can find some unavailable data. If a class is missing, then production is accomplished using classification. The prediction function is important with the growing need for business intelligence.
4. Association Analysis
It compares two or more attributes of data. It relates the data and rules concerning them. Many retail stores like Amazon uses association analysis at the bottom showing, “Customers who bought this also bought…”. This data mining technique helps in showing attributes that are frequently purchased together.
5. Cluster Analysis
It is similar to classification when the data are grouped but the difference is in cluster analysis and the class label is unknown. Here data are grouped based on clustering algorithms.
The objects that are grouped under one cluster will have a huge difference from one another. The grouping is performed to maximize the intraclass similarity and minimise the intraclass similarity. This function is performed in various areas such as image processing, machine learning, pattern recognition, and bioinformatics.
6. Outlier Analysis
It is used when data cannot be grouped in any of the classes. When data will have different attributes to any of the other classes or general models then it will be presented as outstanding data. The analysis of these data is called outlier mining.
These outliers have a big value and are used in many applications despite being regarded as noise or exceptions. The outliers are determined using statistical trials that find the probability. Some other names for outliers are:
• Abnormalities
• Anomalies
• Deviants
• Discordant
7. Evolution & Deviation Analysis
This type of analysis helps in generating time-related clustering of data. We can find trends and behaviour changes over a period. Also, it allows for determining features such as periodicity, time-series data, and similarity in sensations with distinct analysis.
The data mining process and its functionalities are very important in finding many applications from space science to retail marketing.